
Agent Engineering Patterns: Dealing with very large tool results
Agents are models with tools in a loop. Your first job then, when building an agent, is to give them useful tools. But wasting tokens on unimportant information is catastrophic for agent brains, so you need to be careful and protect your agents from tools that can blast out 40,000 tokens in one shot.
You hit this a lot with poorly designed MCP servers, which will often have tools that do stuff like burp out a megabyte of JSON in response to a simple list_users tool. With miles of { and " and , and 0007854cb46727a0973bbf1d2059bd9a in there serving little good purpose, the LLM's attention is wasted and your agent can lose track of its original goal easily.
It's not just bad MCP servers that have this problem, of course. It also shows up with reading large files, or - particularly relevant to Firetiger - querying application logs and metrics, which are often voluminous and full of irrelevant fluff.
This article will lay out two approaches we've taken on this:
- Truncation, which appears simple at first (but is full of subtleties).
- Saved artifacts, which we highly recommend, if you have the infrastructure for it.
We'll end up explaining how we built tools for agents to analyze tool outputs with jq, which cut our median time to answer for difficult questions by 5x and lowered load on our backend systems.
We'll be adding to this series as we go, stay tuned!
Truncating tool results
The first thing you should do is start truncating tool results that are excessive. Set a cap on the maximum size, and just chop things off when you hit the cap. This is really essential. Unbounded tool results can blow out your token budget in one shot otherwise.
You don't need to compute the token size very precisely for this to work, so it's not really worth a remote API call to the LLM provider to tokenize every tool result. We use tiktoken for this. It's plenty fast to run inline on every tool result and come up with a rough estimate that'll be close enough for any of the models we use, not just OpenAI models. Remember: we don't need perfect accuracy here, we just need to detect huge messages.
How many tokens is too many? It probably depends on your use case, but we've put the number at 5,000 tokens for most tools. If the result is over that, it gets chopped off to meet the budget.
Of course, you need to tell the agent that you truncated the result. This is pretty critical. We've found that things perform slightly better if you include this note before the actual truncated tool results, rather than after; probably some quirk of training that is model-specific. You should advise the agent that it is viewing a partial subset of the data, and give it a nudge on how it might use the tool differently to get a smaller result (if that is possible).
You'll need to think about how you present truncation to human users, too. If you truncate a tool result at an arbitrary spot, then its syntactic structure can be broken: JSON is no longer going to parse correctly, for example. This can mean you need to store a separate, untruncated representation of the tool result, and mention in the UI that some values are hidden from the robot's view; this is subtle and difficult to get really right.
If you have well-structured data, sometimes you can smartly redact or truncate the results, while keeping the data well-formed. This is often worth doing just to make the rendering problem much simpler.
Truncation in practice
Here's a real scenario, from our own use of Firetiger to monitor itself. An agent was asked to investigate a reported crash in a Python process in a narrow time range. It dutifully wrote some Confit SQL to query Firetiger's log database:
SELECT
      time,
      severity_text,
      scope.name,
      body.text AS message,
      attributes.error,
      attributes.error_type,
      attributes.agent_id,
      attributes.agent_name,
      attributes.session_id,
      attributes.pause_reason
FROM "opentelemetry/logs/superagent"
WHERE time >= TIMESTAMP '2026-03-24T16:21:09Z'
    AND time < TIMESTAMP '2026-03-24T16:31:09Z'
    AND (
      severity_text IN ('ERROR', 'FATAL')
      OR (severity_text = 'WARN' AND attributes.error IS NOT NULL)
      OR attributes.error IS NOT NULL
    )
    AND (attributes.agent_id IS NULL OR attributes.agent_id != 'agents/h3lu7w82mbm2')
ORDER BY time DESC
LIMIT 100
Here's the result the agent received:
These query results were modified to fit under token limits.
Modifications made: reduced from 30 to 15 rows

  [
    {"time": "2026-03-24T16:30:34.764683Z", "severity_text": "ERROR", "name": "superagent", "message": "{\"timestamp\": \"2026-03-24 16:30:34,764\", \"level\": \"ERROR\", \"logger\": \"superagent\", \"message\": \"Agent hit an error
   during execution\", \"module\": \"structured_logging\", \"function\": \"exception\", \"line\"...[TRUNCATED: 1093B→224B]", "error": null, "error_type": null, "agent_id": "known-issues-expert", "session_id":
  "00078299ed93c86bb300f06292beb6c6", "pause_reason": null},
    {"time": "2026-03-24T16:30:34.753608Z", "severity_text": "ERROR", "name": "firetiger.nexus_agent", "message": "{\"timestamp\": \"2026-03-24 16:30:34,753\", \"level\": \"ERROR\", \"logger\":
  \"firetiger.nexus_agent\", \"message\": \"OpenAI API call failed\", \"module\": \"structured_logging\", \"function\": \"_log\", \"line\"...[TRUNCATED: 995B→224B]", "error": "Error code: 400 - {'error': {'message': \"We
  could not parse the JSON body of your request. (HINT: This likely means you aren't using your HTTP library correctly. The OpenAI API expects a JSON payl...[TRUNCATED: 420B→199B]", "error_type": "BadRequestError", "agent_id":
  "known-issues-expert", "session_id": "00078299ed93c86bb300f06292beb6c6", "pause_reason": null},

...
]
That's largely because all the log lines contain enormous embedded JSON-formatted lines containing stack traces. Even 30 of these was over the token budget.
But in this case, the first 15 rows were enough to give the agent a sense of where to go. The agent rewrites the query to aggregate better: GROUP BY the structured fields, drop the raw message column, and compute some summary statistics:
  SELECT
    COALESCE(attributes.error_type, '') AS error_type,
    COALESCE(attributes.error, '') AS error,
    COALESCE(attributes.agent_id, '') AS agent_id,
    COALESCE(attributes.agent_name, '') AS agent_name,
    COALESCE(attributes.session_id, '') AS session_id,
    COALESCE(attributes.pause_reason, '') AS pause_reason,
    COALESCE(scope.name, '') AS scope_name,
    COALESCE(body.text, '') AS message,
    COUNT(*) AS row_count,
    MIN(time) AS first_seen,
    MAX(time) AS last_seen
  FROM "opentelemetry/logs/superagent"
  WHERE time >= TIMESTAMP '2026-03-24T16:21:09Z'
    AND time < TIMESTAMP '2026-03-24T16:31:09Z'
    AND (
      severity_text IN ('ERROR', 'FATAL')
      OR (severity_text = 'WARN' AND attributes.error IS NOT NULL)
      OR attributes.error IS NOT NULL
    )
    AND (attributes.agent_id IS NULL OR attributes.agent_id != 'agents/h3lu7w82mbm2')
  GROUP BY 1,2,3,4,5,6,7,8
  ORDER BY row_count DESC, last_seen DESC
  LIMIT 50
This second query worked way better. The agent found the distinct error patterns, and was able to dig in more deeply without having blown out its context.
The keys here are:
- Tell the agent when you're truncating
- Still preview the first few tokens of the result so it has a chance of understanding why the tool result was so big
- Give it tools that let it navigate around the problem with filtering and aggregation (not always possible - this is a useful feature of our internal query tools!)
Saving tool results
Truncation works, but it can be unwieldy for tool calls that take a while to execute. In our query example, the query engine needs to go off and executed this big query task, collect results, and present them, only for them to be mostly thrown away.
In addition, truncation of structured data is subtle and difficult to get right. It's not always easy to find the right place to snip data while keeping syntactic structure for UI rendering or other tools.
So, an alternative method that we've switched to is to save the un-truncated, un-redacted, large tool result, but give the agent tools to browse the result. This has grown common in user-side coding harnesses; you'll see Claude Code stuff tool results into files when they are large, which lets it slice-and-dice with Bash commands. This sort of thing, for example:
● Bash(grep -A 5 '"message 5"\|"message 6"\|"message 7"\|"message
  8"\|"message 9"'
  /home/swnelson/.claude/projects/-home-swnelson-go-src-github-com-firetiger-
  inc-core-3/db776563-2fb1-453a-90fb-1a10eef12a99/tool-results/bp912549i.txt
  | head -100)
  ⎿  (No output)

● Bash(grep -n "message [0-9]"
  /home/swnelson/.claude/projects/-home-swnelson-go-src-github-com-firetiger-
  inc-core-3/db776563-2fb1-453a-90fb-1a10eef12a99/tool-results/bp912549i.txt)
  ⎿  2:--- message 0 ---
     12:--- message 1 ---
     31:--- message 2 ---
     50:--- message 3 ---
     68:--- message 4 ---
     99:--- message 5 ---
     116:--- message 6 ---
     147:--- message 7 ---
     163:--- message 8 ---
     171:--- message 9 ---

● Read(/home/swnelson/.claude/projects/-home-swnelson-go-src-github-com-firet
  iger-inc-core-3/db776563-2fb1-453a-90fb-1a10eef12a99/tool-results/bp912549i
  .txt · lines 99-298)
  ⎿  Read 87 lines
If your agent framework supports it, you can do this same thing. The steps are:
- Store the tool result as an artifact somewhere durable.
- When you're presenting the tool result to the LLM, pass a reference to the artifact instead of the full contents - some stable ID.
- Give the agent a tool to be able to access those artifacts by ID, and include a mechanism for slicing-and-dicing.
That's pretty much it! If you give the agent good guidance on this tool, it should be able to browse the tool results even if they are over the token budget.
Slicing-and-dicing with jq
It can be tricky to figure out the right slice-and-dice mechanism; we've settled on jq filters though which let agents construct queries that directly analyze the JSON data in a result artifact.
To make that work, you need to know that the tool result actually is JSON, which can be a little tricky. In our case, we've built our own agent framework at Firetiger called Nexus (a blog post for another day), and it stores these tool results in object storage with an associated MIME type that is sniffed out of the tool result text.
The read-the-artifact tool is a relatively simple one to describe to the LLM. We require the ID of the artifact, and optionally can take line numbers to zoom in on, byte limits to zoom in on, and a jq filter expression. We give it a very small amount of help on the jq language:
    Description: JQ filter expression to extract/transform JSON data. Only applies to JSON artifacts (including protobuf, which is converted to JSON). Applied after slicing. Use this to reduce token usage by filtering before loading.
    Examples:
        .[] | select(.error != null) — find rows with errors
        .[:10] | .[] | {time, message: .body} — first 10, simplified fields
        map(.attributes.service_name) | unique — unique values
        [.[] | select(.body | contains("login"))] — substring search
        group_by(.service) | map({service: .[0].service, count: length}) — count by field
Informing the agent when results are saved
We modify tool results when they are over the threshold. In this new framework, we present the first row of data and the names of the columns. So for example, here's a gnarly aggregation of some structured logs' attributes:
  SELECT
    epoch_ms(CAST(floor(epoch(time)/900)*900*1000 AS BIGINT)) AS bucket_15m,
    resource.attributes.service.namespace AS namespace,
    COUNT(DISTINCT resource.attributes.service.instance.id) AS instances,
    MAX(attributes.bytes."current") AS peak_bytes_current,
    MAX(attributes.bytes."limit") AS bytes_limit,
    MAX(attributes.bytes.shed) AS peak_bytes_shed,
    MAX(attributes.commits."current") AS peak_commits_current,
    MAX(attributes.commits."limit") AS commits_limit,
    MAX(attributes.commits.shed) AS peak_commits_shed
  FROM "opentelemetry/logs/ingest-server"
  WHERE time >= NOW() - INTERVAL '24 hours'
    AND body.text = 'flushing ingested data'
  GROUP BY bucket_15m, namespace
  ORDER BY bucket_15m DESC, namespace
  LIMIT 500
We return a tool result that advises that the data is too large, and should be analyzed as an artifact:
  Query returned 500 rows × 9 columns.
  Columns: bucket_15m, namespace, instances, peak_bytes_current, bytes_limit,
           peak_bytes_shed, peak_commits_current, commits_limit,
  peak_commits_shed

  Full results stored as artifact (id:
  08bf7fd5b7d7a571e5c68a541f232d56a65b854239384f1d75e2280ddd5a318b,
  content_type: application/json).
  Use read_artifact with a jq filter to extract the data you need, e.g.:
    read_artifact(sha256="08bf7fd5...", jq=".[:10]")
    read_artifact(sha256="08bf7fd5...", jq='[.[] | {time, body}]')
The LLM comes back with jq queries virtually every time. They can be quite sophisticated! In this example, the agent wrote the following, an extremely fancy jq filter:
  read_artifact(
    id="08bf7fd5b7d7a571e5c68a541f232d56a65b854239384f1d75e2280ddd5a318b",
    jq="group_by(.namespace)
        | map({
            namespace: .[0].namespace,
            min_instances: (map(.instances) | min),
            max_instances: (map(.instances) | max),
            peak_bytes: (map(.peak_bytes_current) | max),
            bytes_limit: (map(.bytes_limit) | max),
            any_bytes_shed: (map(.peak_bytes_shed) | max),
            peak_commits: (map(.peak_commits_current) | max),
            commits_limit: (map(.commits_limit) | max),
            any_commits_shed: (map(.peak_commits_shed) | max)
          })
        | sort_by(-.max_instances)"
  )
Results of using jq and artifacts
How well does this work? Fantastically well for our querying use case.
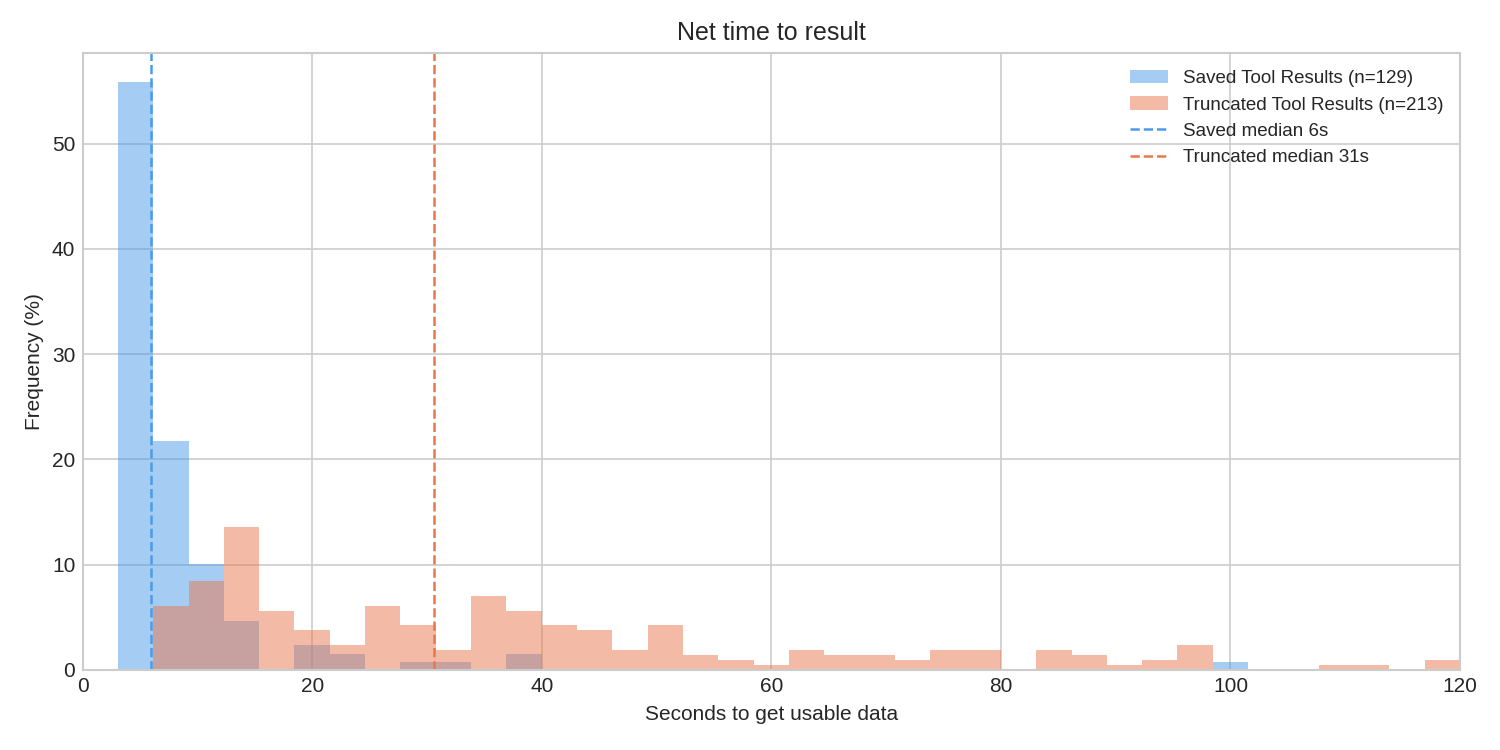
By saving the query result, we avoid expensive round trips through the data lake. Queries that blow out token limits are often ones that also are expensive to execute, so this has major benefits. The execution of a jq filter using the superb gojq implementation is extremely quick, so we have seen the median time to getting useful data drop by about 5x, from 31s to 6s; that 6s is virtually entirely LLM thinking time now.
One concern we had going in was that the jq language might be too obscure. Could the LLM generate valid query expressions?
This turned out to be completely trivial for the model. In thousands of invocations, we have yet to see a single parsing error, which is really remarkable.
We have seen a very small incidence of it getting operator precedence wrong, particularly in the binding rules of or versus | (it turns out that x | y or a | b gets parsed as x | (y or a) | b) but this has only occurred three times in our observation of the data.
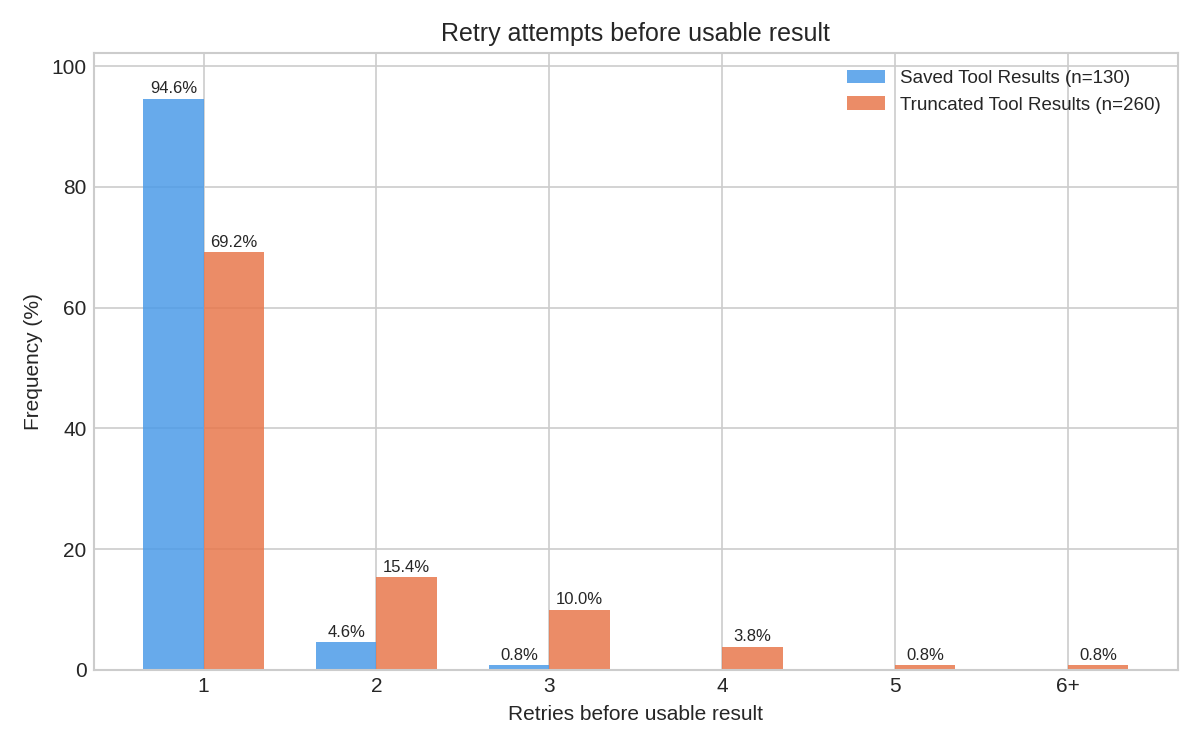
As mentioned above, it writes thoroughly sophisticated jq filters, as well, which generally mean it gets its answer in one try rather than multiple. With truncation, the agent has to try to guess at the right move to make to trim down the result set, but it is not really given expressive enough tools to browse and analyze the data. With saved artifacts, we've found that the LLM one-shots its analysis in 94% of cases. Truncation performed much worse:
Where to go from here
Truncation is virtually necessary if you're implementing any sort of agent framework, but browsable saved artifacts have dramatically improved our agents' performance.
Today, that boost is heavily governed by our ability to cast tool results into JSON. That's usually the case, but we're interested in exploring more ways to express analysis on different content types. What would a jq for XML or plain textual data look like? Will we be re-inventing shell pipelines for text analysis? How can we do that safely?
There's always more to be done!