
Agentically optimizing LLM prompt cache TTLs for fun and profit

A case study on production objective hill climbing
Firetiger runs a few hundred large language model (LLM) agents in production, and prompt caching is a critical tool to manage the cost of running such a workload. Properly setting cache time-to-live (TTL), how long a cached prefix survives before the next request pays full price again, is critical to reaping maximum benefit from prompt caching. The catch: the "right" TTL is a property of the workload, and not something you can intuit up front.
Case in point: we were quietly burning spend on cache writes that cost more to write than they ever saved us on read. All of this information was spread across a multitude of data sources and generally hard for a human to reason about, let alone methodically improve upon.
So! We pointed a Firetiger agent at our own telemetry and bill and gave it one objective: "drive down prompt-cache waste". From there, it hill-climbed against that goal the way every Firetiger agent works: each day it measured where the money is going, recommends config and code changes to improve on performance against our goal, brings humans into the loop to approve fixes, and then re-measures. Over a few weeks that took about 77% off what we were wasting in overly long TTLs and missed cache write opportunities, with a residual that continues to asymptotically converge on zero.
Let's dig in on how we made this 77% improvement (with commensurate dollars back in our bank account) happen.
A quick word about caches and TTLs
I spent a chunk of my career running the Cloudflare CDN, which is another way of saying I spent a chunk of my career thinking hard about cache TTLs. A CDN is a giant distributed cache sitting in front of a lot of origin servers, and every cached object carries a TTL, or time to live: hold it for X seconds, or an hour, or a week, and when that TTL expires, go back to the original server ("the origin") it came from to see if it changed. Set the TTL too low, and you send more traffic than needed to the origin and pay for the misses; set it too high and you serve something stale, or incur additional admin overhead purging stale assets.
Prompt caching for LLMs is a similar problem, with the units changed. When you send a prompt to Claude (as an example LLM; each behaves roughly similarly in the prompt caching domain) you can mark a prefix as cacheable, and the next request that shares that prefix reads it back instead of reprocessing it, billed at a fraction of the input price. Anthropic gives you two TTLs, a default five-minute cache and an extended one-hour cache (the prompt caching docs have details).
Cache writes aren't free: on Sonnet a write to the five-minute cache runs 1.25x the base input price, a write to the one-hour cache runs 2x, and a read runs 0.1x. So a cache only pays for itself if you get enough reads per write to cover the write premium. On the one-hour tier that break-even is roughly one extra hit per write, and anything below it means the cache is a tax you're paying for nothing.
You can't compute the right TTL
OK, this seems like a straight forward math problem! We know the write/read prices, we know roughly what our traffic does, and so surely we can just solve for the correct TTL, right? Alas, realized hit rate at a given TTL depends on how we're holding the LLM/what your agent workload actually looks like.
And the workload is constantly changing! A new agent ships, a deploy reshuffles a system prompt, a customer onboards, the shape of the access distribution changes.
You could try to build a closed-form model to predict how TTL changes will behave. It's hard, and any answer you come up with will be wrong by the next deploy, because the inputs keep changing. The honest move is to run experiments in production: flip a TTL, watch a day of telemetry, keep the change or roll it back. That's hard too, and in a slower way. Doing it methodically across a fleet means babysitting hundreds of (deployment, agent, model) combinations on a rolling schedule, and nobody has that attention to spare. Perhaps we could use an agent to automate this!!!!!
The loop
Firetiger the company uses Firetiger the product to improve our own product.
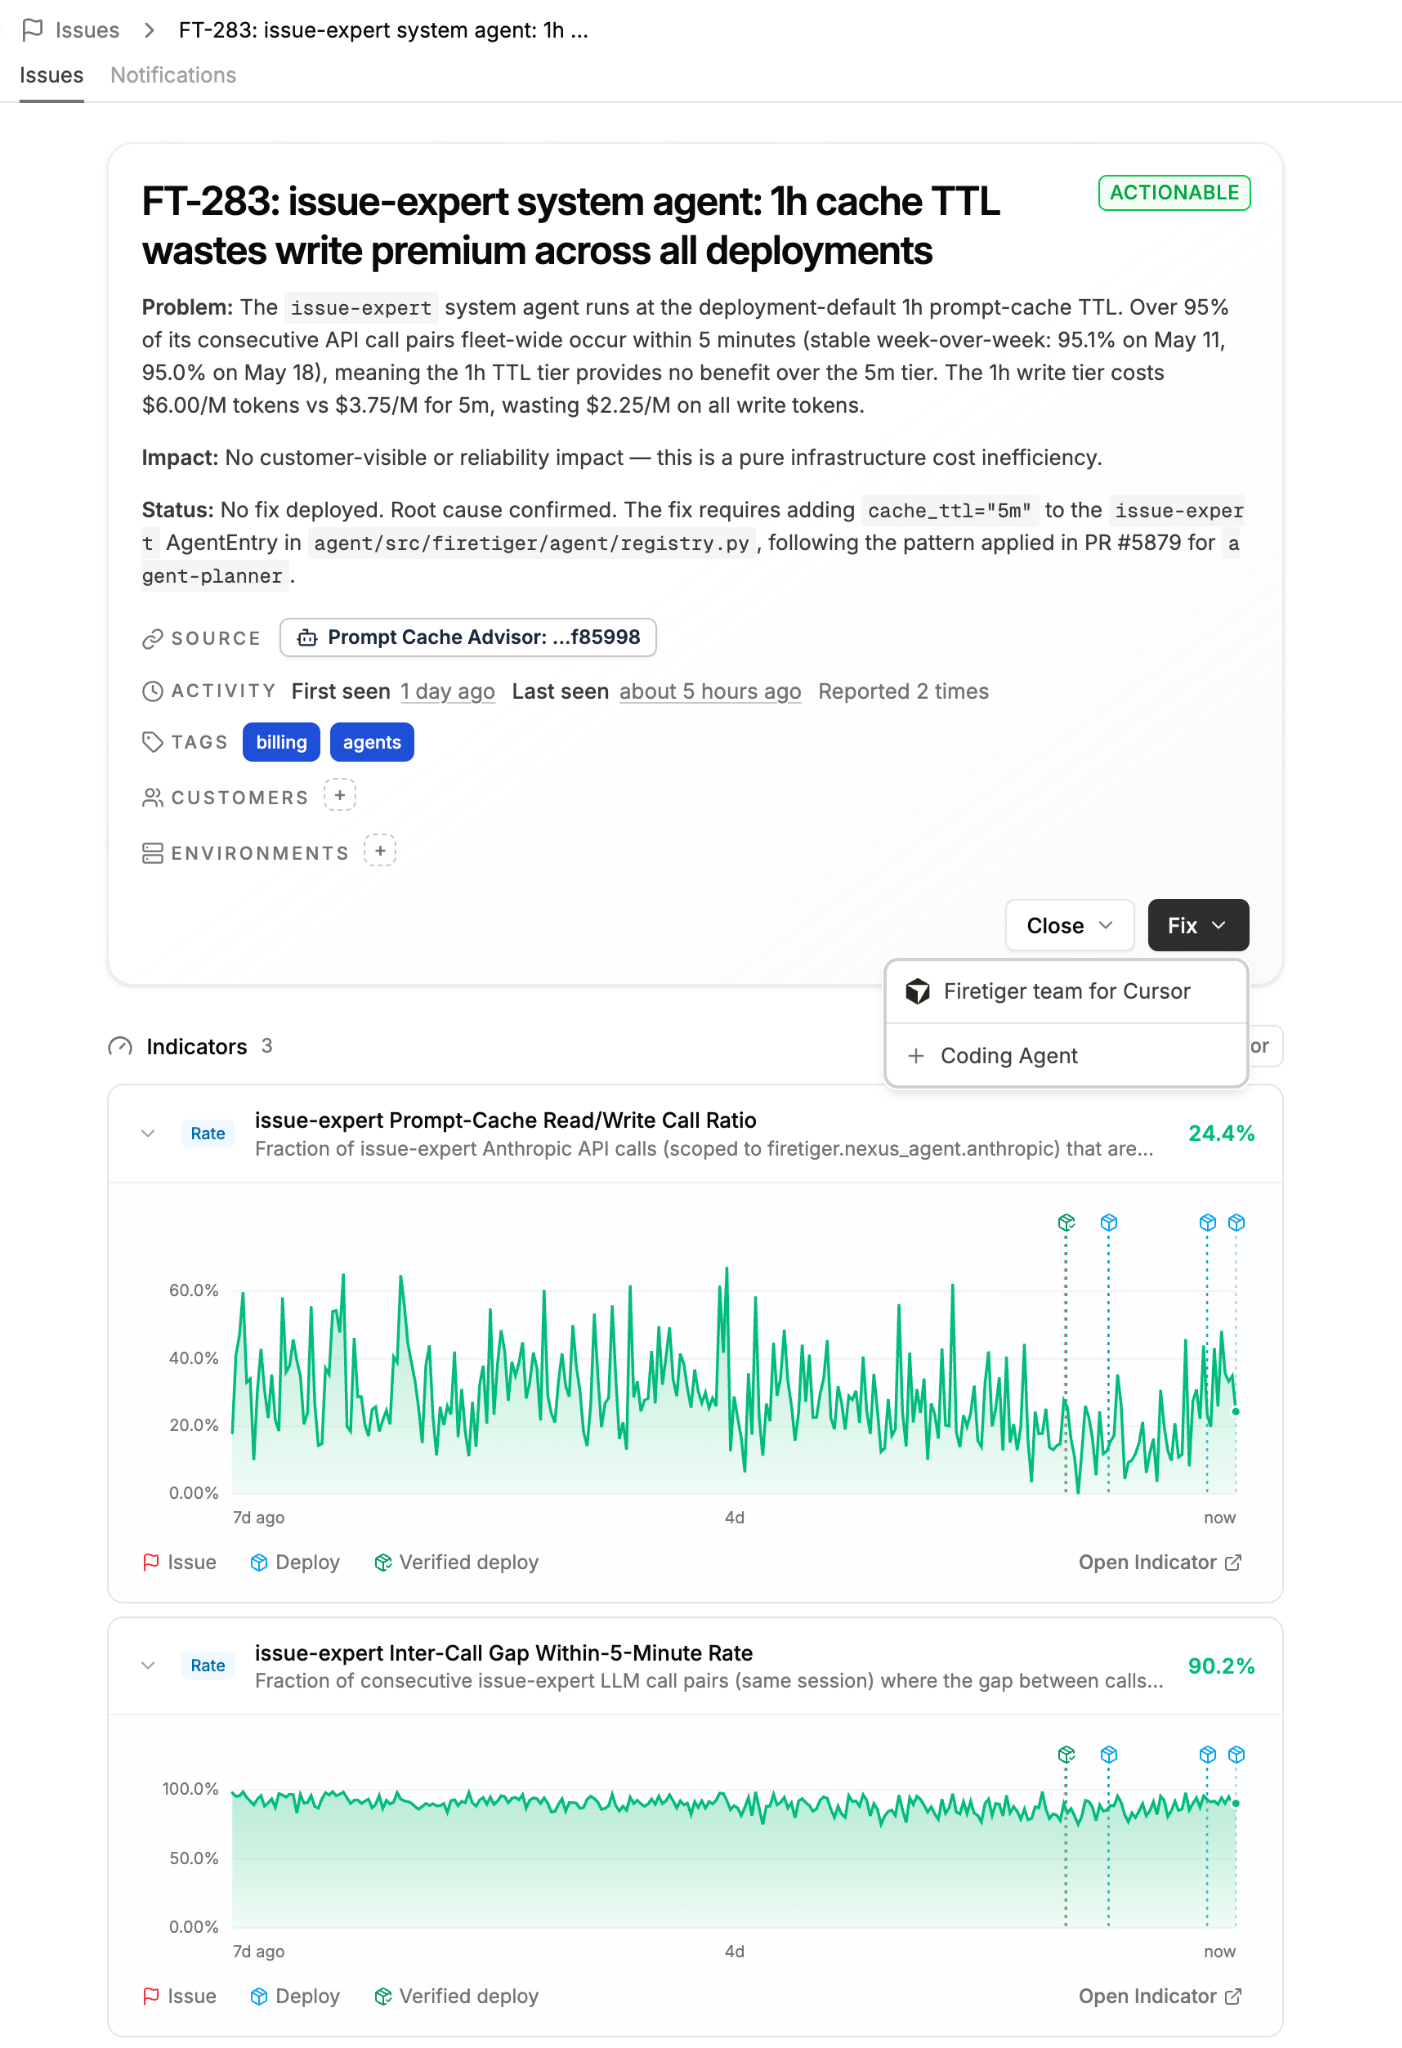
We stood up an agent we call the Prompt Cache Advisor, and its objective, in plain language, is to find prompt cache waste across every deployment, work out the cheapest TTL for each agent, and show its work. It pulls logs on token usage, computes a read-to-write ratio for every (deployment, agent, model) group, prices each one against the current Anthropic and Bedrock rate cards, and proposes and ranks code changes by how much impact they'd have on cache utilization. Taking these changes into prod is then a question of a human clicking "Fix" on the issue, and "Merge" on the PR.
The reports are specific enough to act on. From a real run:
- switch FT_CACHE_TTL from 5m to 1h, saves ~$1,242/mo (38%). Change: set FT_CACHE_TTL=1h in Terraform for ft-xyz.
- agent-planner (all deployments): the 1h cache writes cost more than the reads recover. Saves ~$3,215/mo by moving to 5m. Change runner.py:166 to cache_ttl="5m".
- investigation-summarizer: many cache writes that are never read. Remove cache_control at nexus_agent/anthropic.py:205.
Each day, we iteratively refine our caching strategy with the help of our trusty, persistent agents.
The Advisor also tracks one objective of its own, "Monthly Cache Savings," the total projected dollars still sitting on the table across all of its open recommendations.
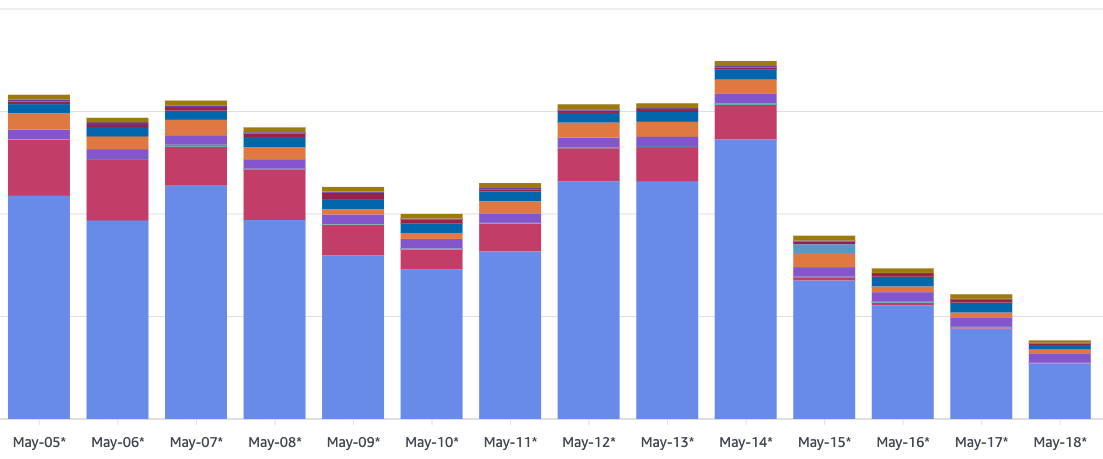
Each day's run hill climbs from where the last one left off: it measures, it proposes, the changes land, and it measures again. Our savings number actually went up before it came down, as the agent got better at seeing the surface and one fix exposed more of it, then down as big changes shipped. When the loop is doing its job that number heads toward zero, and the daily report turns into a list of things to leave alone.
Brute force vs surgical improvement
Surgical changes beat brute-force ones. The brute-force move with cache tuning is to find one setting that works on average and apply it across the fleet; for prompt cache TTLs the obvious answer is "set everything to one hour." The Advisor and its scalpel outperform that approach easily.
Our agent-planner agent is the clearest case:
- unique planning sessions
- almost no prefix reuse (r/w around 0.49)
- on the one-hour tier its cache writes cost more than running with no cache at all.
Correct move: set the TTL at 5m.

The ROI for surgical over brute force usually breaks on the cognitive load required to do it. A human running this campaign by hand would have to read every agent's traffic, do the arithmetic per (deployment, agent, model), decide direction, write the PR, and recheck next week when the workload moves. That's a lot of skilled engineer brain time! The Advisor does it on a cron and only asks a human to click "Merge". And say “w00t”.
What landed in production
Here are four of the changes the loop has driven into prod in the past couple of weeks. None of them is a big architectural move on its own, but combined, have reduced spurious cache write charges by 77%
Cross-region Bedrock profiles weren't taking the cached path
The Advisor's same-agent comparison flagged the gap first: on identical prompts, issue-expert was running at a 39.7% cache hit rate on Bedrock against 77.1% on the direct Anthropic API, and agent-planner at 11.1% against 48.9%. The investigate agent walked it down to one regex. The model-client router only sent IDs starting with anthropic. or arn: through the cached AnthropicModelClient, so anything that came in as a cross-region inference profile (global.anthropic.*, us.anthropic.*, and the European and Asian equivalents) fell through to a separate Converse client that never emitted cachePoint blocks. The fix widened the routing match to ^(?:[a-z]+\.)?anthropic\..
Our system-prompt prefix wasn't staying byte-stable across runs
The Anthropic prompt cache matches a byte-identical prefix from byte zero up to a cache_control breakpoint, which means anything non-deterministic in the system-prompt busts cache.
The Advisor saw the symptom (cache writes high, reads low on agents that should have been hitting), and the fix turned out to be several separate sources of un-needed prompt entropy stacking up to hurt cache efficiency.
- Two of them were classic Go-map order leaks: our harness implementation was iterating a map[Tool]... without sorting, so the tool list came out reshuffled run to run,
- … and in a different part of the codebase, Names() returned its slice unsorted, so the same problem reappeared one layer up.
- A third: synthetic-time injection stamping mid-conversation timestamps with now(), which drifted the cached prefix as the wall clock advanced; that one now uses the activity-boundary timestamp for mid-conversation injections and keeps now() only for the trailing block that lives past the cache breakpoint.
- The fourth issue: we were concatenating a platform_context block into the cached system prompt, but that context includes a daily-changing onboarding day counter, so the cached prefix went stale every midnight. The fix split it into a stable cached block plus a volatile non-cached suffix, via a new system_suffix parameter on the model client.
To ensure these fixes are durable, we've added prompt-determinism and byte-stability tests to our test suite.
One stack occasionally couldn't use the global Bedrock profiles at all
One of our customers' AWS Organization policy explicitly denies bedrock:InvokeModel on global.* foundation-model resources, so their stack couldn't use the global cross-region profiles every other deployment defaults to. The fix was a one-line override pinning to us.anthropic.* regional profiles. Because the cross-region routing fix above means regional and global Anthropic profiles both take the cached path now, this customer ends up getting the same hit rate as everyone else.
Our Go agents weren't caching their conversation history
Our change-monitor and the long-running investigation agents only had cache breakpoints on the system prompt and the tool definitions. Each new turn was re-paying full input price for the prior turn's accumulated tool_use and tool_result blocks, so the cost of a long session grew roughly quadratically with turn count.
We added a third cache breakpoint on the conversation tail and set the default TTL for those agents to one hour, because their between-turn gaps routinely exceed five minutes (change-monitor waits on deploy workers, investigate waits on humans). Turn N+1 now reads turn N's full transcript from cache at about 10% of input cost instead of re-paying full input price for it.
	var systemPrompt strings.Builder
	...
	// /!\ agentTools is a map[string]*Tool, iteration over
	// the keys is not deterministic and explicitly randomized
	// the Go runtime.
	//
	// This causes the system prompt to be a variation of all
	// ordering combinations, causing cache misses until all
	// variations have been written to the token caches!
	for name, tool := range agentTools {
		fmt.Fprintf(&systemPrompt, “- %s: %s\n”,
			name,
			tool.Description,
		)
	}
Each of those was a small, file-level fix the Advisor agent turned up in the course of doing its job. Stacked up, iterative and continuous improvement really, really compounds!
How to do this yourself
If you run LLM agents in production you have some version of this problem, and odds are you can't currently see or improve on it. None of the pieces required to make progress are exotic:
- You need telemetry on every model call, including information on model, caller, cache writes, cache reads, etc.
- Create a production agent with a cost objective, and point it at the telemetry. Teach the agent about current rate cards and reads-per-write math per caller.
- Put the agent’s recommendations where the people who own the code will actually see them, and make the recommendations concrete and directly actionable.
- Keep a human in the loop to watch over things. There is still some nuance and human judgement required to run these hill climbing loops effectively. (For now?)
Firetiger gives you the first three without much effort: it ingests the telemetry, it runs the agents, and the agents file what they find where your team already works. A cost objective is just an objective like any other you'd hand an agent, and a daily cadence is just a schedule. We pointed it at ourselves first because we had the bill and the curiosity, and because tuning a cache against production logs is a thing some of us have been doing for a long time. If you got here from staring at a Datadog invoice instead, we have opinions about that too.
Closing the loop
The prompt cache TTLs across our deployments now sit at roughly the right values, and the daily Advisor report has mostly become a list of configs to leave alone with a shrinking tail of small fixes underneath it.
How'd we drive our prompt cache efficiency way up? Simple!! A Firetiger agent watches the reads-per-write ratio across our fleet, proposes the next change, waits for a human to merge it, and measures what happened, every day, forever. Handing this job to an agent improved cache write efficiency by 77%, and the number keeps improving.
If you've ever stared at an LLM invoice and wondered where the money went, the answer is usually in the cache, and the fix is to let Firetiger watch it for you.