
Firetiger Service Monitors: continuous improvement for your entire application
Firetiger Service Monitors automatically bootstraps best-practice observability for your entire application. Firetiger discovers your application’s architecture, breaks it down into logical Services, and then recommends Service Level Objectives that are continuously grounded in historical telemetry and behavior. Unhealthy Objectives get automatically Investigated, triaged, and escalated to you as Issues. You spend less time fixing queries and tweaking dashboards, more time working on stuff that makes your customers happy.
Firetiger already monitors your pull requests as they get deployed, so you can be confident that every change works as intended in production (or not).
But software in production can break in many other fun ways, not always around the time of an obvious change or deployment. Usage patterns shift, memory leaks, your colleague decides to update a DNS record, the HVAC repair guy trips over a wire in us-west-2… how to keep tabs on all this?
This is the age-old-problem space of “Software Observability.” Over the decades, the industry has produced many philosophies, frameworks, standards and products to address these problems. Observability products of yore give you the tools and workflows to setup your own production software monitoring, with a few simple steps:
1. Decide What to Monitor
What system behavior is required? What do end-users expect? How do you break a system down into smaller observable parts?
A common observability strategy is to break down your application into Services: logical components that emit their own telemetry (logs/metrics/traces). In a microservice architecture, a service might literally be the individual services (typically containers). In a monolithic architecture, a service might be a discrete API, group of endpoints, or some other logical breakdown of functionality.
Service-oriented observability, while not a panacea, is a great starting point because it fits engineer’s mental models of how their application and organization are structured. A service’s behavior is defined by its code, infrastructure, and usage patterns. Services are typically owned and operated by individual engineers or teams, so accountability comes out-of-the-box.
2. Measure What’s Important
For each service behavior you want to monitor, you then need to decide how to measure it. The popular Google SRE Handbook calls this an Indicator: “a carefully defined quantitative measure of some aspect of the level of service that is provided”. For example, an Indicator for a web application might be “% of valid requests that return 5xx errors.”
To define an indicator, you need to query your software telemetry, which means you’ll need to learn a bit of PromQL or LogQL or SomeQL (or have an LLM write it for you).
3. Set Objectives
Now that you can measure some system behavior with an Indicator query, you need to set an Objective: a target value for a service level Indicator. An example of an Objective might be: “Fewer than 0.1% of valid requests return 5xx errors.”
Objectives force you to think about some important properties of your system. To do this well, you ideally work backwards from end-user expectations: How fast do my users expect the page to load? What API error rate is acceptable for this endpoint? Etc. In practice, it’s often easier to bootstrap these thresholds by reviewing historical data, and iterate on them over time.
4. Maintain This Forever
Finally, all of this Objectives and Indicator monitoring needs to be maintained and iterated upon as your software changes, usage patterns change, user and organizational expectations change, alerts become too noisy, the software instrumentation changes… forever (or more realistically, as long as your company’s observability guru still works at the company).
Simple…?
Observability for the Rest of Us
Not Simple! You can play this game if you’re a big organization with the means to staff many site reliability engineer(s). But most of us don’t have that luxury. We have to own our own reliability and observability with limited resources. It’s essential work, with real toil, and detracts from precious time we’d otherwise spend solving problems for customers.
At Firetiger, we heard this recurring feedback from our customers: “Help us monitor our application according to best practices: bootstrap monitoring on Day 1, continuously manage and maintain it on Day N, so we can confidently focus on building our software business.”
So, we built a product to solve this problem, and gave it an exciting name: Service Monitors. It’s now available in beta for you to try today.
Here’s how it works.
1. Firetiger Discovers Your System Architecture
You already use Firetiger for Change Monitoring, with Github and Telemetry connected. Firetiger analyzes your code, logs, metrics, and traces to discover your application’s architecture.
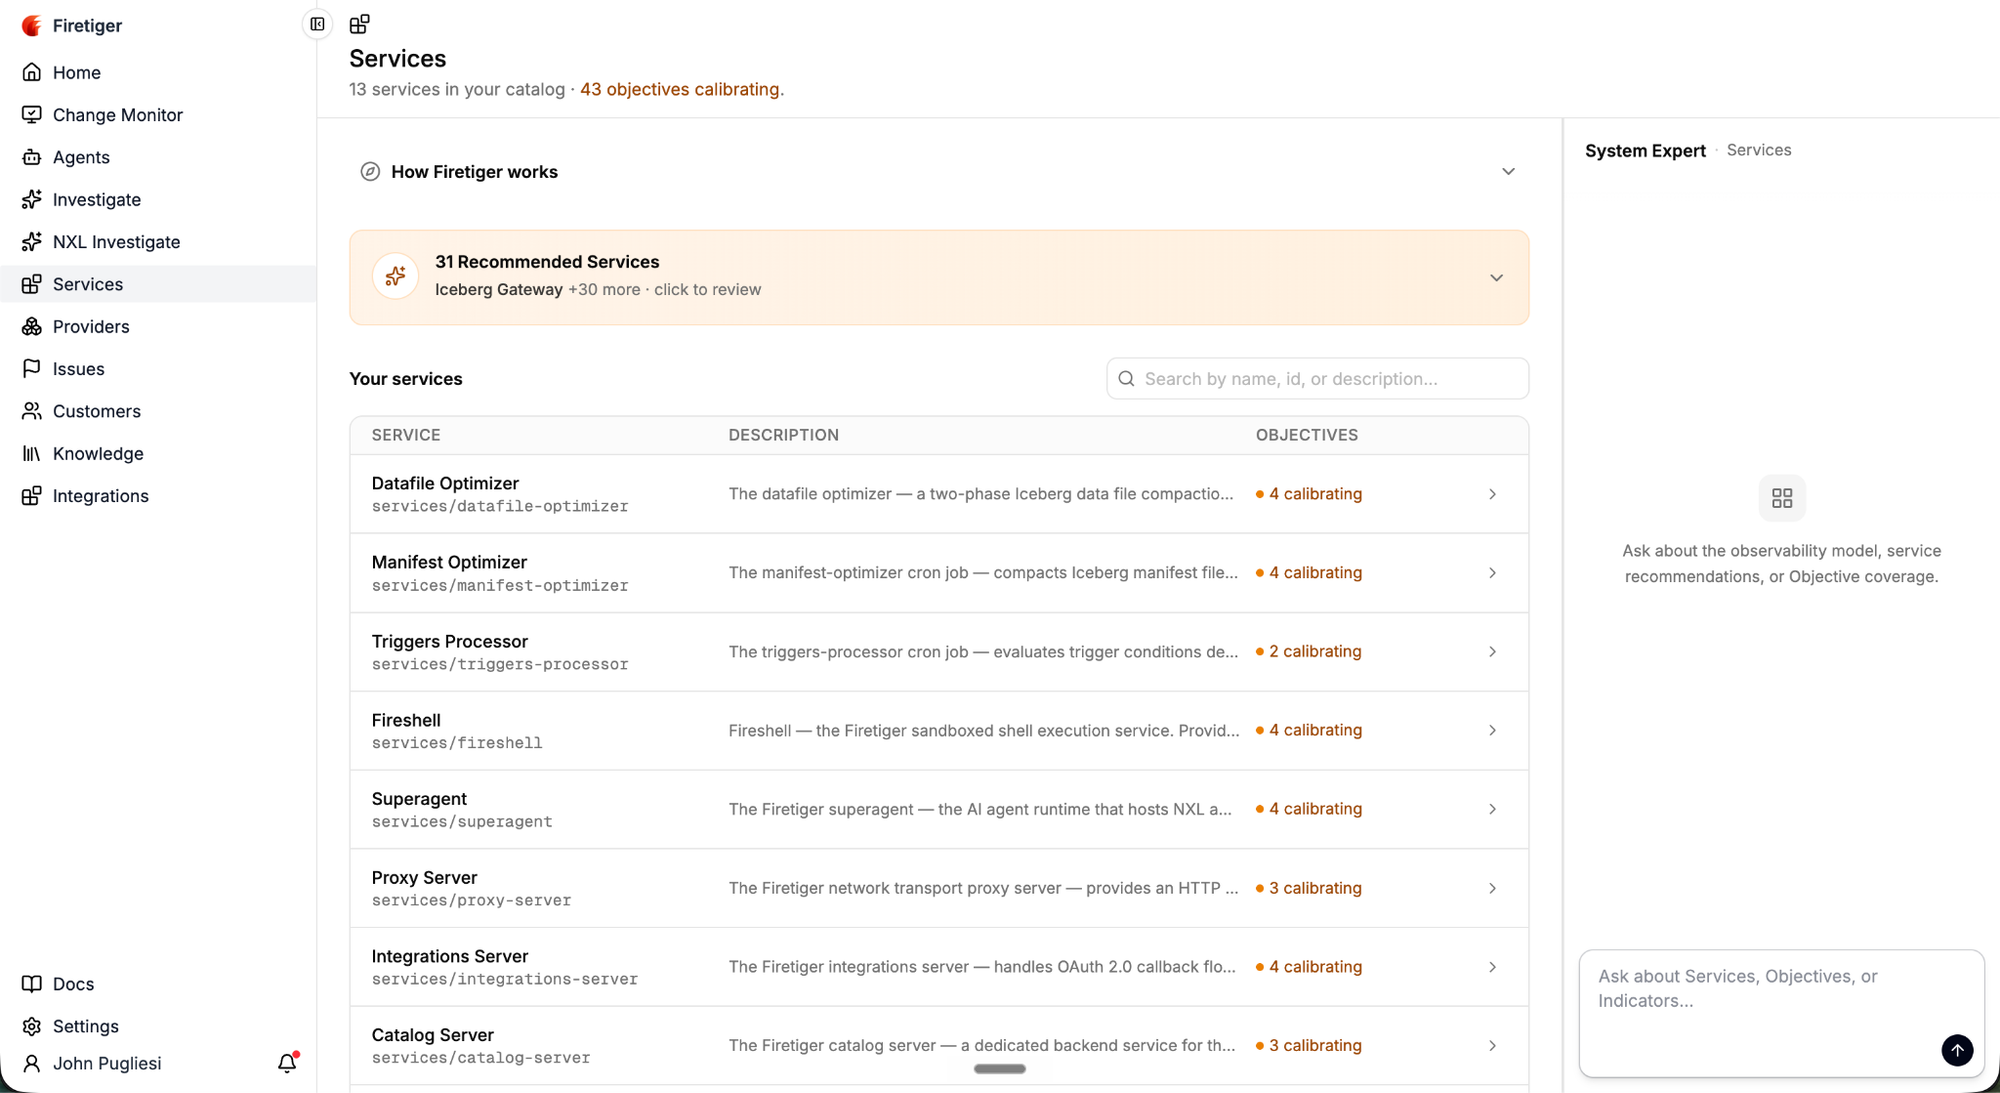
2. Firetiger Recommends Service Level Objectives (SLOs)
For each discovered Service, Firetiger recommends Service Level Objectives and Indicators based on its actual logs, metrics, traces.
3. Services Get Monitored
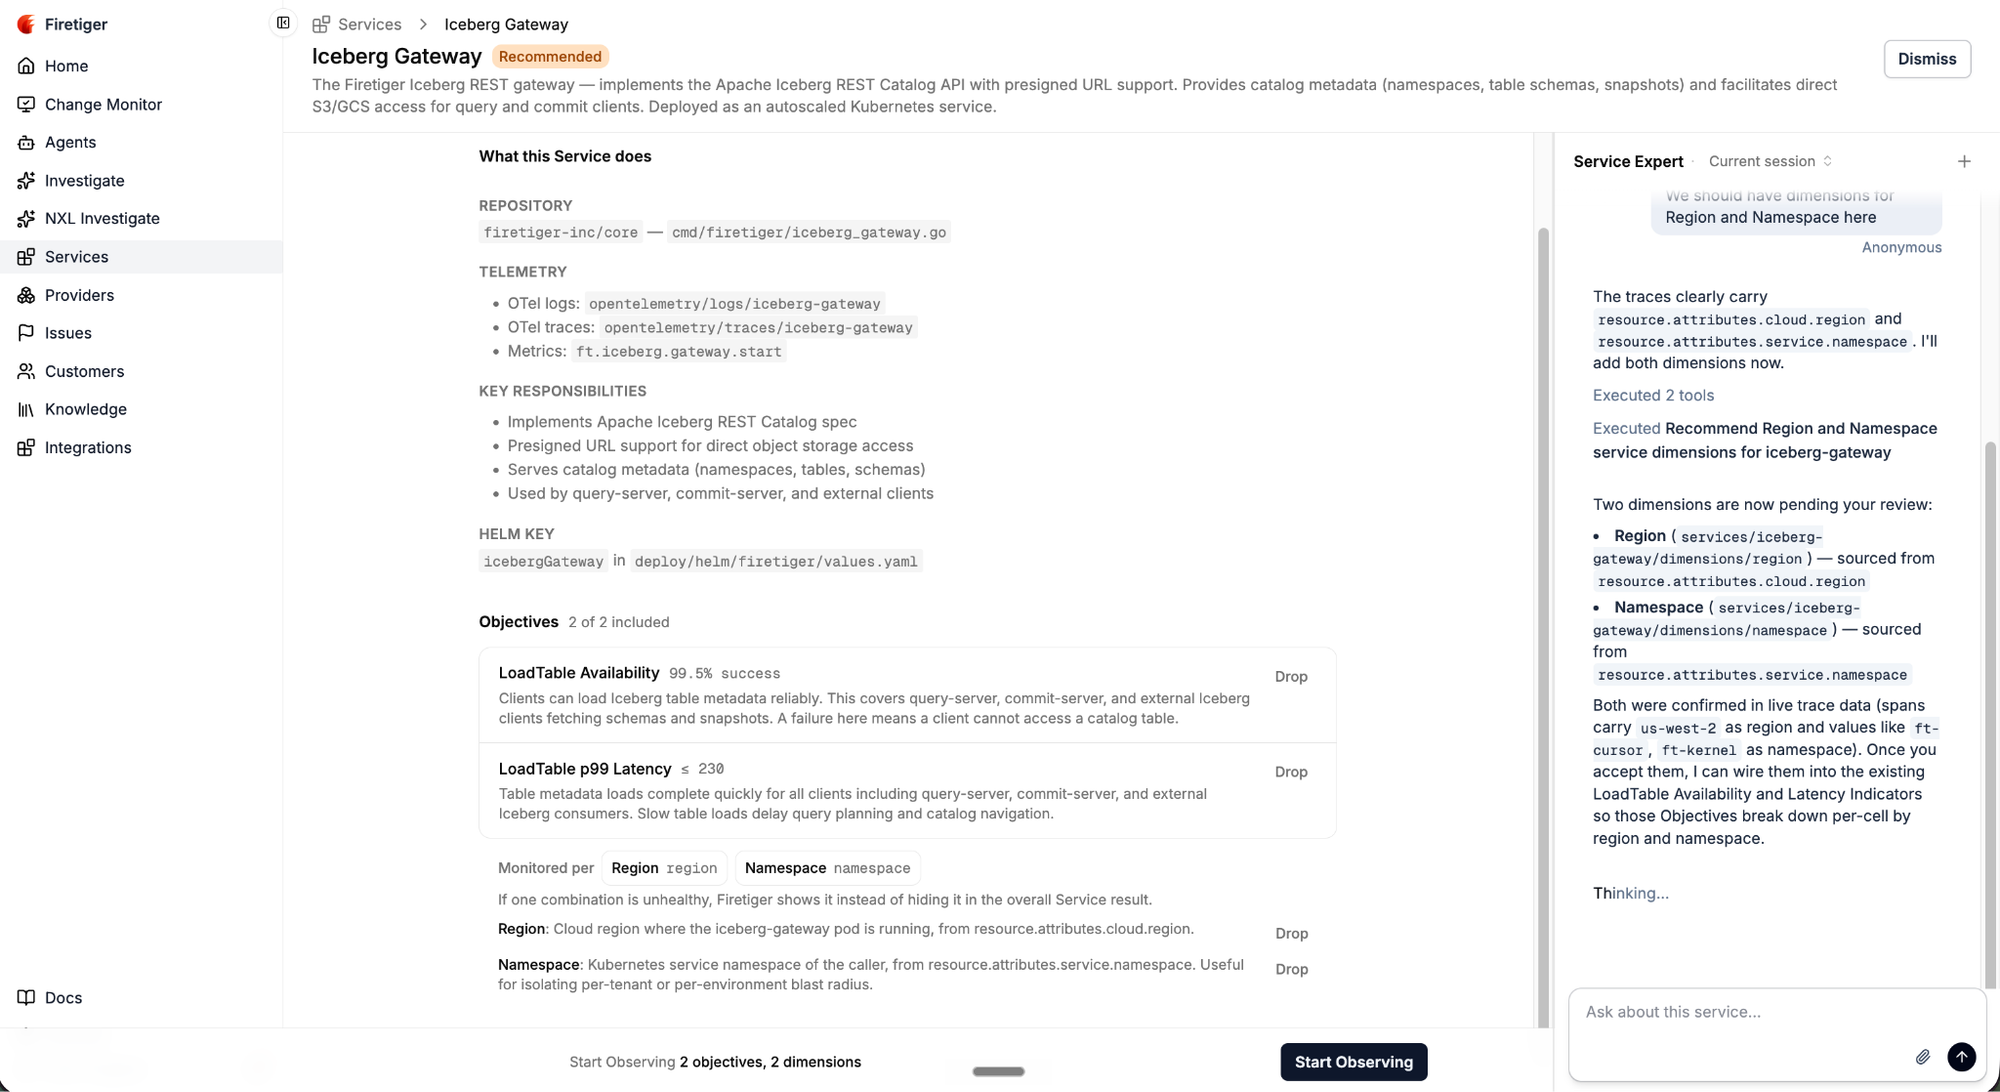
Once you accept Firetiger’s recommended service monitoring, each Objective calibrates a reasonable target threshold based on historical data over a 3 day period (you can also configure this threshold yourself).
Once calibrated, Objectives run 24/7, monitoring your Environments independently so a healthy pre-production environment does not statistically hide an issue in production. If the Objective’s indicator query breaks, e.g. due to changed logs/metrics/trace data, it will automatically heal itself. If the service’s baseline behavior seriously drifts and the objective becomes too noisy, it will propose an updated threshold.
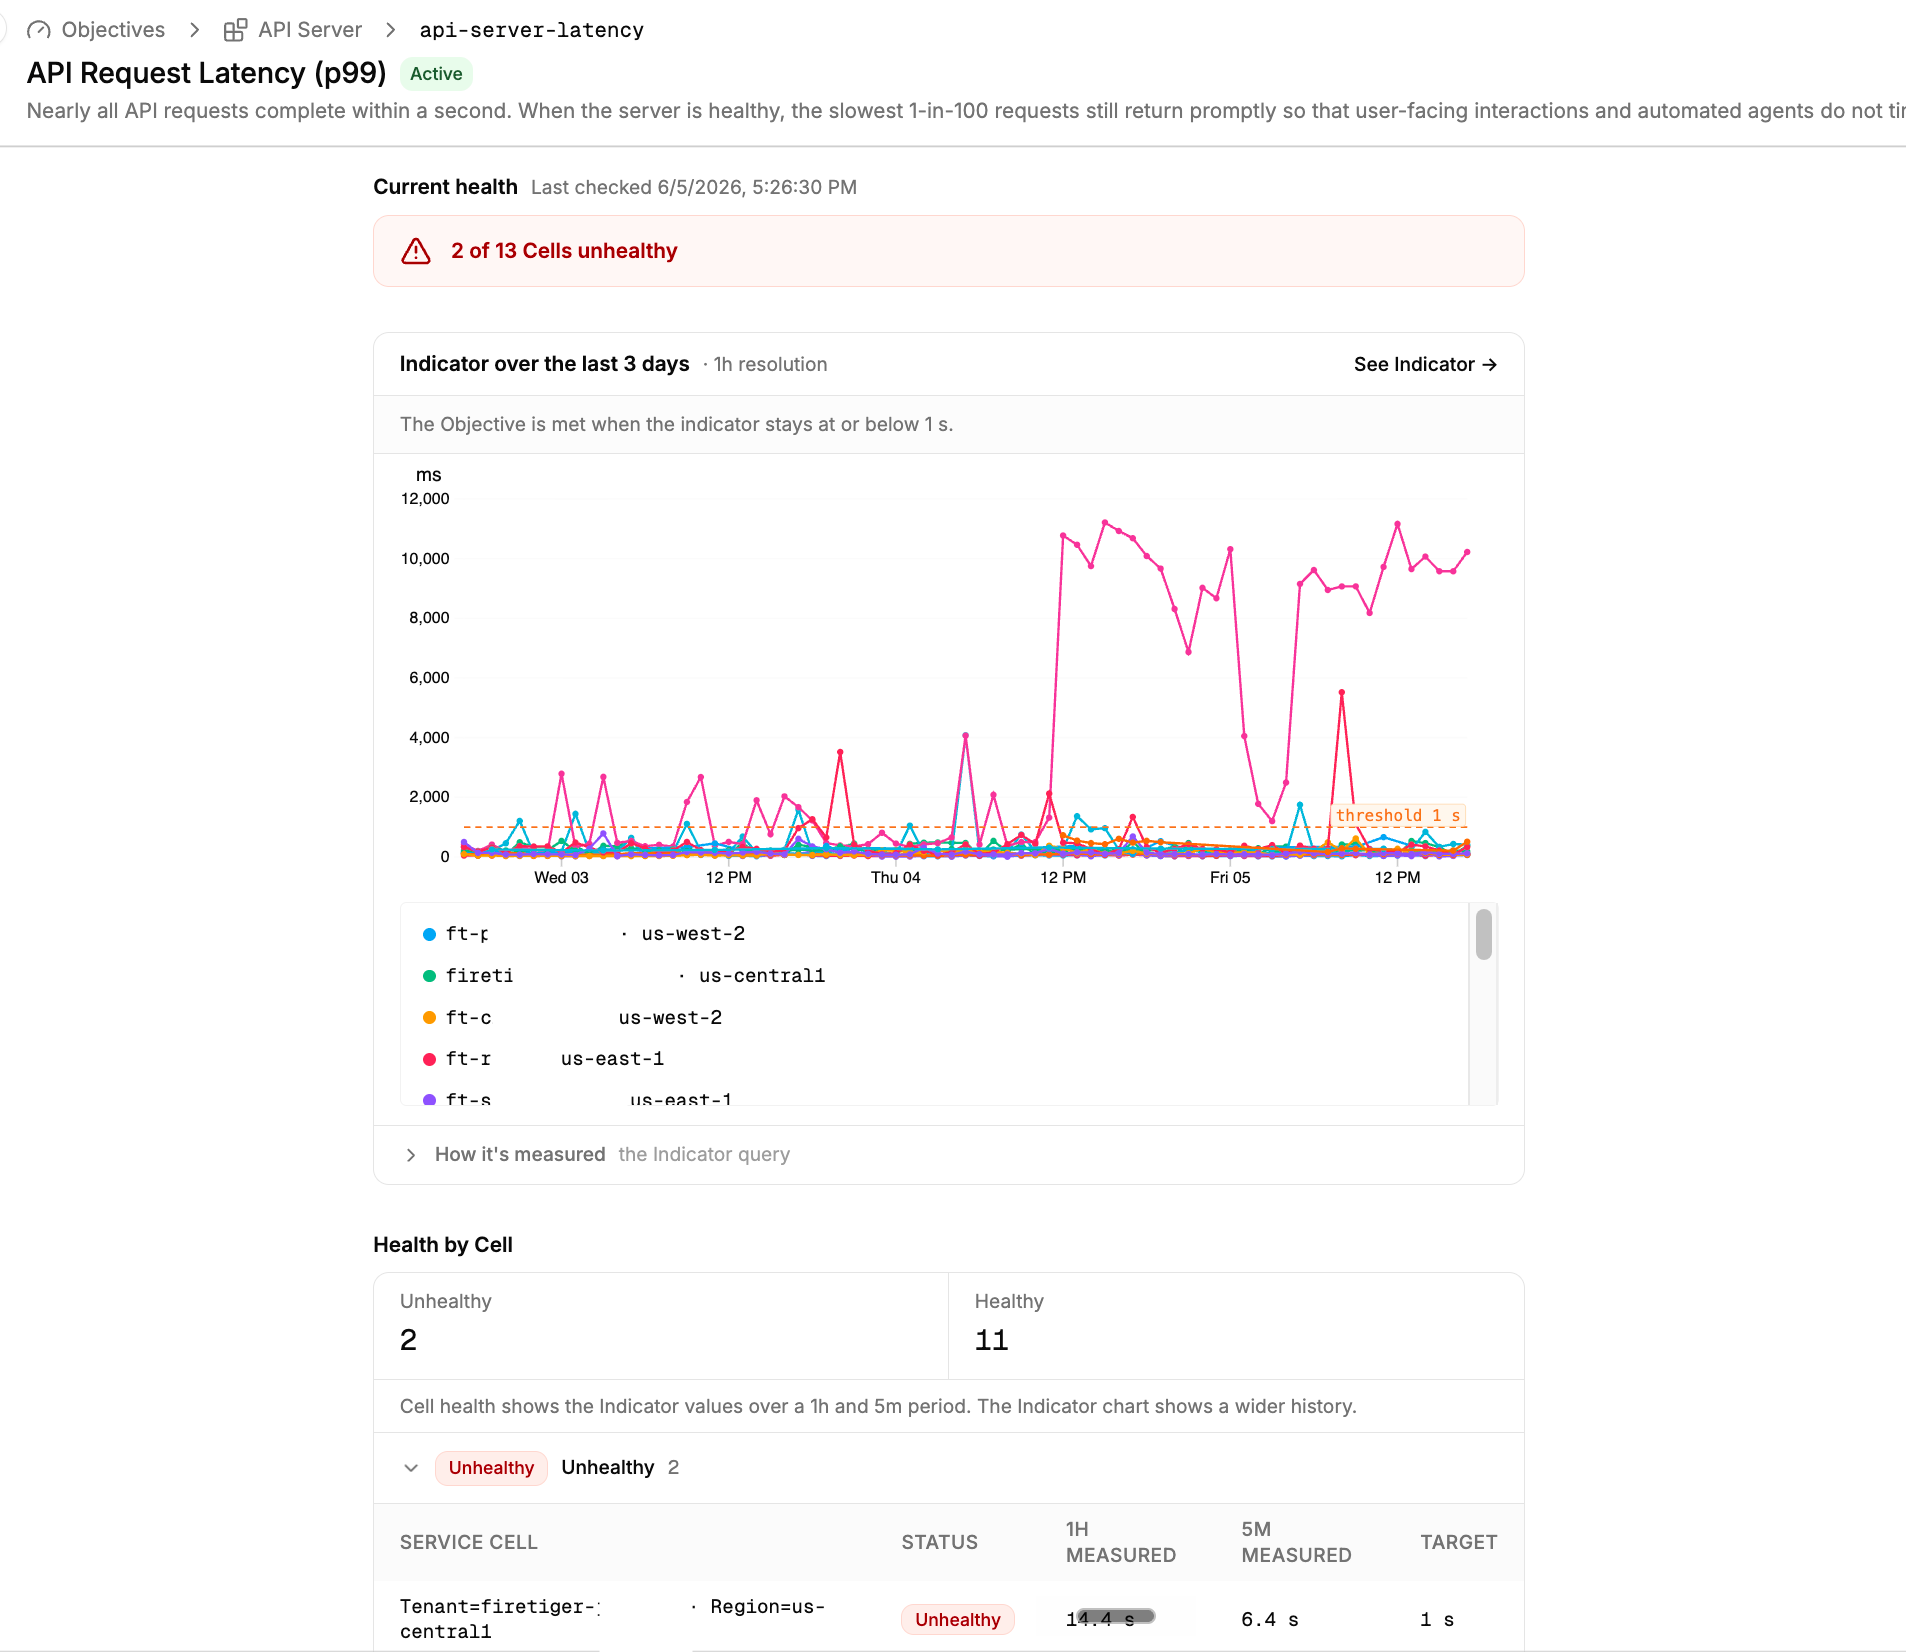
When an Objective detects an unhealthy environment, an Investigation is immediately kicked off to triage the problem, and eventually escalate an Issue with complete context on scope and impact.
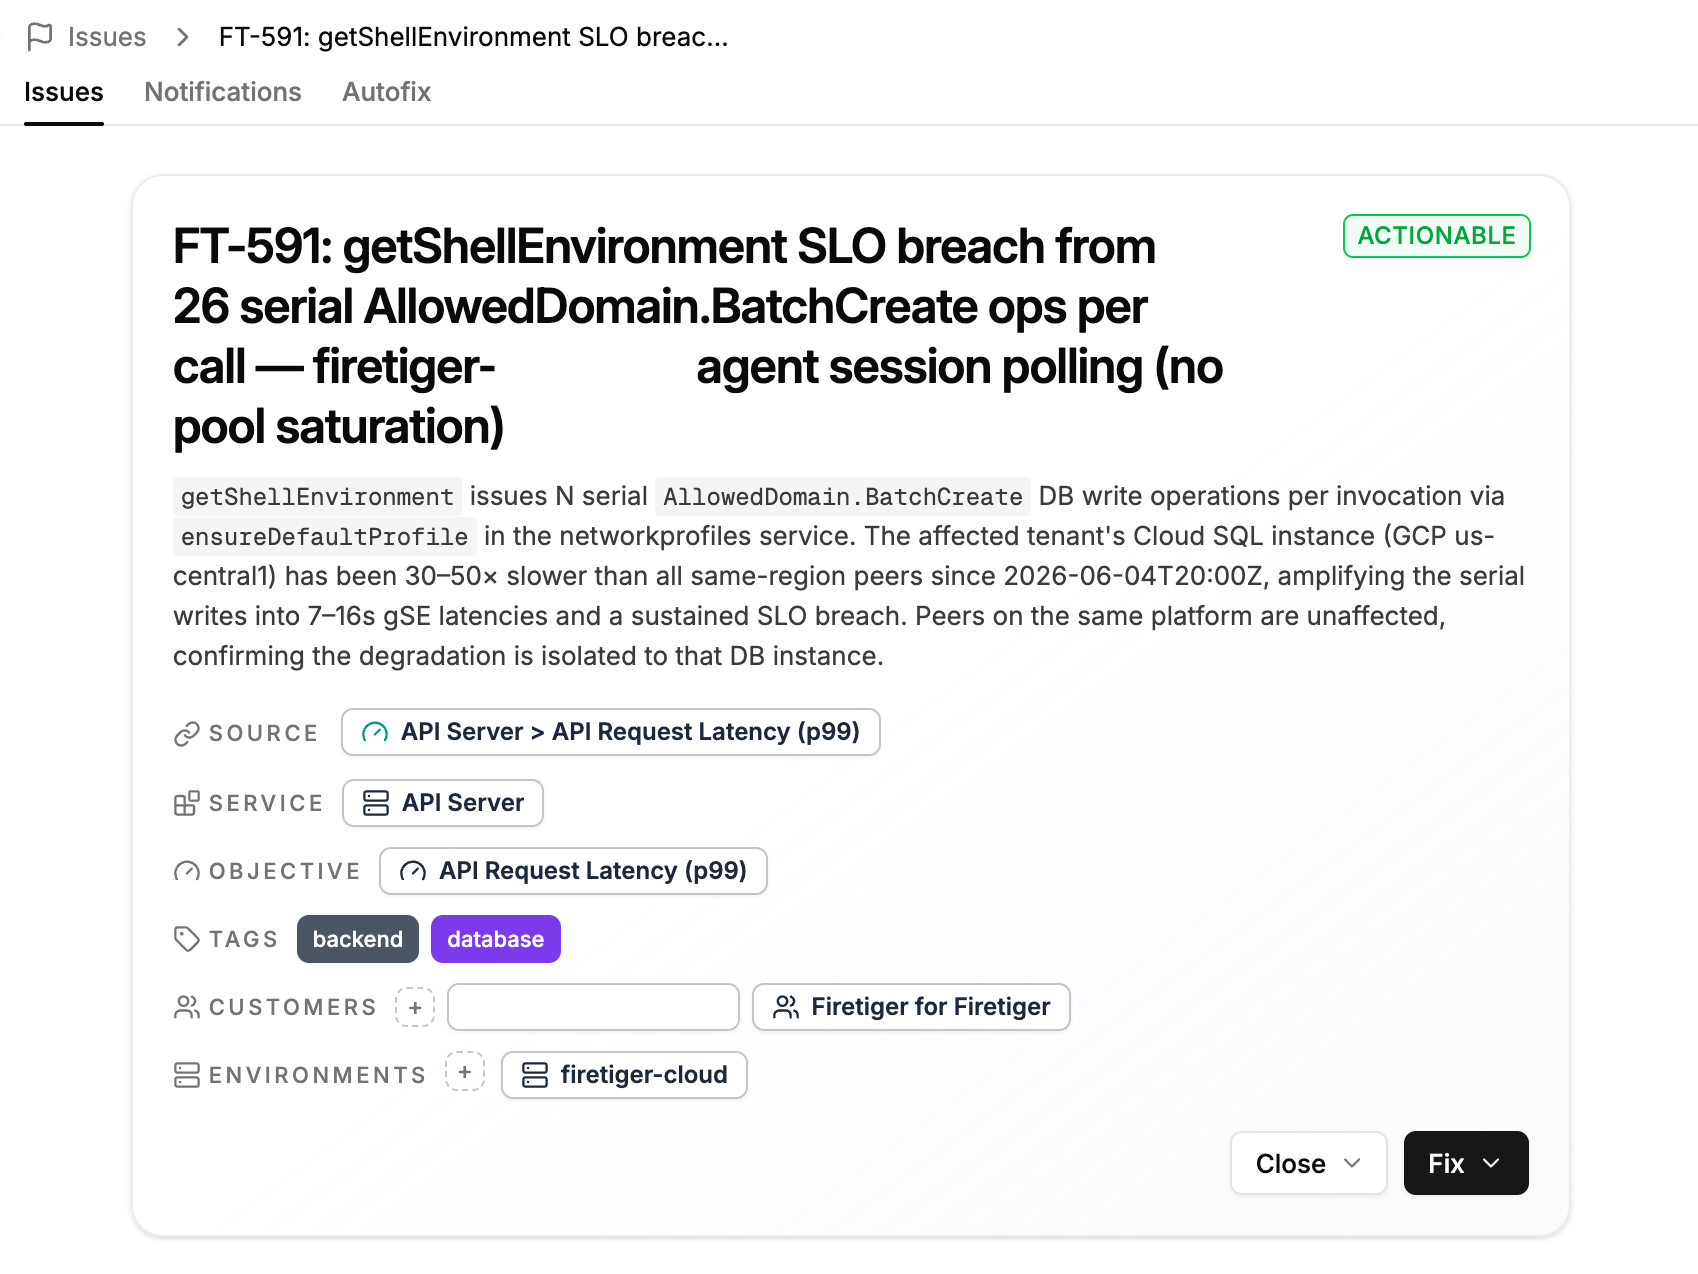
From here, you can click Fix (or let Firetiger automatically trigger it for you), and your coding agent gets to work with an actionable description of the problem.
The coding agent puts up a Pull Request, Firetiger creates a Change Monitoring Plan to ensure the intended effect is successfully observed once deployed in production.
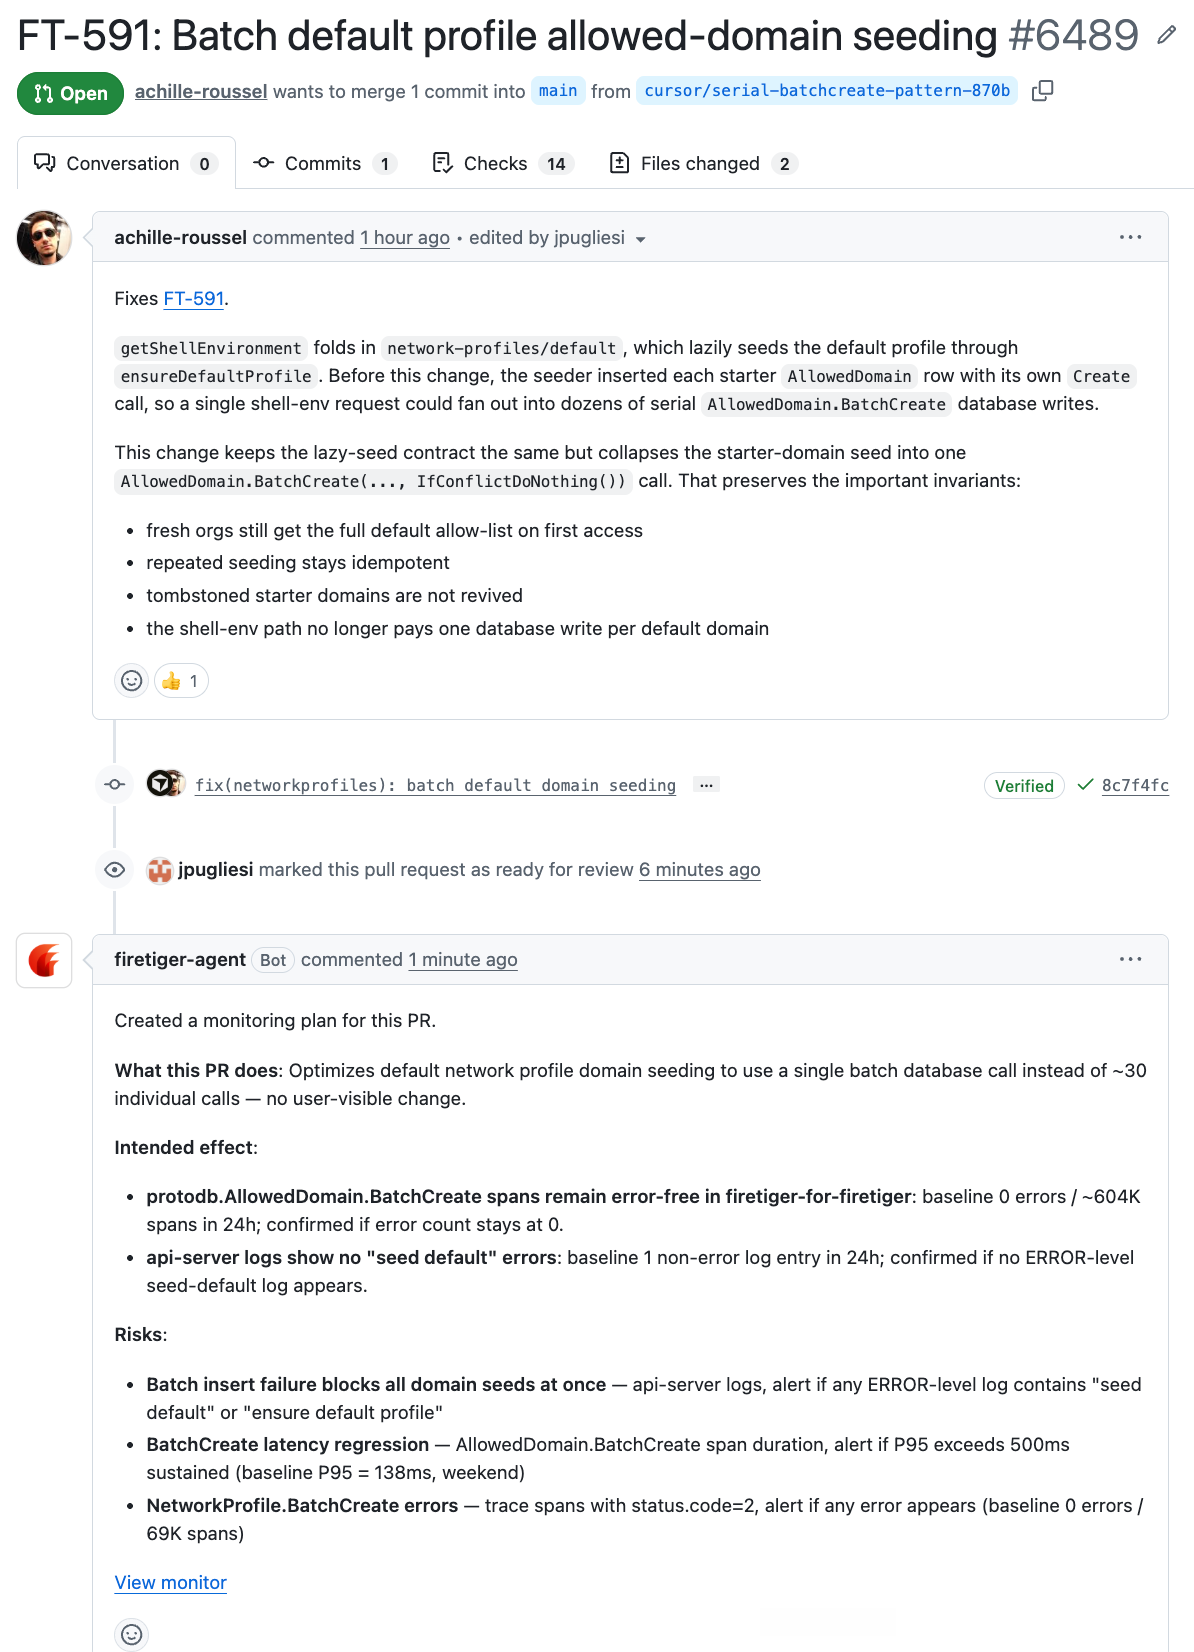
Once the intended effect is confirmed, the Change Monitor clears and the Issue is closed as Resolved.
Rinse and repeat.
Start Monitoring Your Services Today
Try Service Monitors free while it’s in beta! You can sign up at https://ui.cloud.firetiger.com/sign-up. We’ll announce pricing in the coming weeks.